
Often when making a point in an argument or drawing conclusions from data, the phrase “statistically significant” is tossed around. Rarely, if ever, is the justification for such significance expounded upon. Even in the cases where it is, there may not be a clear indication of what makes the finding statistically significant.
Definition
Significance is the probability that a type I error will occur for a given hypothesis. More broadly, it is a measure of whether the statistical information on a given data set is sufficient to support the claim being made. The significance of results can be improved by increasing the acceptable window of answers or by increasing the sample size. The balance between the range of likely values and the sample size is capture by the significance level.
Hypothesis Testing
Statistical analysis involves hypothesis testing to prove or disprove something about the population being studied. If the mean length, µ, of a given part in a factor is estimated to be 3.00 inches, this would value would form the basis of the hypothesis test. The item you are trying to validate is the null hypothesis, H0 (pronounced “H naught”). This corresponds to an alternate hypothesis, H1 , which is the opposite of H0. Without digging too deep into hypothesis testing, general goal is to determine if you can reject the null hypothesis or fail to reject it.
Error Level
This test is drawing conclusions on a population based on a sample of data. Rarely is information obtained on every possible member of the entire population. The extension of conclusions can result in errors. Type I error is when the null hypothesis is rejected, but is actually true. Type II error is failing to reject the null hypothesis when it is actually false.
Imagine we sample 15 parts from the factory (n = 15). The sample mean, ,of the parts could possibly be a range of values. The acceptable limit for the sample mean may be such that 2.5 ≤ ≤ 3.5 inches. If the sample mean falls in this range, the value would be sufficiently close to 3.00 such that we would fail to reject the null hypothesis that µ = 3.00 inches. Outside of this unacceptable limit, however, we would reject the null hypothesis that the population mean in 3.00 inches.
The significance, represented by α, is the probably of type I error given the acceptable range. That is, the probability that we would reject the null hypothesis based on the sample data, even though it is actually true. The probably is calculated using the standard normal distribution and applying the central limit theorem. The above methods demonstrate the statistical significance for a set acceptable range. The other way to approach quantifying the significance is through a minimum significance level, or p-value.
P-Value
The p-value is the smallest level of significance that would result in rejection of the null hypothesis, or essentially the amount of risk you are willing to accept that the null hypothesis was incorrectly rejected. The use of this value allows for testing the significance of the data without preemptively creating an acceptable upper and lower limits. The significance is determined based on the sample mean and compared to a standard for risk allowance.
A common p-value is 0.05 and represents a 5% chance that a randomly selected point will lie above or below the acceptable range (for a two-sided test). For this significance criteria, the desired significance level determines the acceptable range.
Use in Analysis
There are conventions for what to use as a p-value threshold. P-value is common, but not the only possible value. Depending on the acceptability of errors for a specific process or perhaps even field, the threshold may be adjusted accordingly. If the sample size cannot be changed, the acceptable range of values or the acceptable error can be increased. There is an innate balance between the significance of results and the amount of acceptable error when making conclusions. It is important to understand what parameters were used to conclude that result is statistically significant. The person who made the conclusion may be willing to accept a higher error value than you are.
Mathematics Example
Returning to the example of parts in a factory, let’s walk through an example calculation of significance. The analysis will consist of sampling 5 items (n = 5) from the manufacturing floor. We are hypothesizing that our population mean, µ, is equal to 3.00 inches. We are considering the two-sided analysis and that give us
If we set upper and lower limits of 2.75 and 3.25, respectively, this makes our acceptable range for sample mean ![]()
The significance level, probability of type I error, for the two-sided case, is the probability that is less than the lower end of the acceptable region plus the probability that it is greater than the upper end – when the true mean is actually 3.00. Assume that the standard deviation of length is known to be σ = 0.5. Applying the assumption that the distribution follows the central limit theorem, the standard normal distribution can be calculated to determine the probabilities of each case.
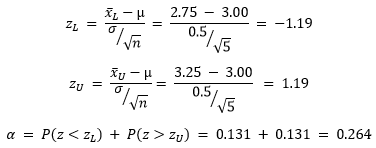
This means that, for our specific parameters and data set, there is a 26.4% chance the population mean of the 5 pieces we test will be outside of our acceptable limits when the true mean is actually within the limits. If that were the case, we would reject our null hypothesis even though it would be true. This level of error may be higher than what you are comfortable with. It can be seen that increasing the size of n would reduce the value of Z, and in turn reduce the value of alpha. A sample size of 25 brings the change of type I error down to 1.2%.
Another option would be to change the values of the acceptable limits. As an alternative, the p-value could be determined and then compared to some preset level.
For this approach, we will assume that the observed sample mean is and test the null hypothesis that ![]() We can assume a symmetrical distribution giving a range of 2.87 to 3.13. The P-value is given by:
We can assume a symmetrical distribution giving a range of 2.87 to 3.13. The P-value is given by:
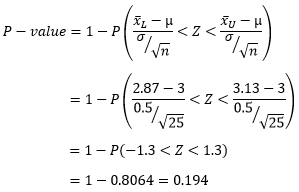
For a test of 25 samples with the sample mean , the smallest level of significance that would result in rejection of the null hypothesis is 0.194. This is much higher than the standard value of 0.05. The risk of wrongly rejecting the null hypothesis is 19.4%. This is a higher risk than the previous example where the acceptable range was wider. If we considered 20% an acceptable risk level, we could determine that the results of this test are statistically significance and we can conclusively reject the null hypothesis. If we use the standard value of 0.05, we would fail to reject the null hypothesis.
Wrap Up
There are multiple parameters that determine statistical significance. Significance is a measure of the probability of type I error – rejecting the null hypothesis when it is true. The significance can be calculated for a range of acceptable limits to determine the probability of type I error if the sample mean falls within the specified range.
Another method is to determine the p-value based on the sample mean and compare to some preset level of risk acceptance. The most widely used value is 0.05, but this can change based on application. The most direct way to reduce the occurrence of type I errors is to increase the sample size. When reviewing any material that established statistical significance, it is imperative to investigate the underlying assumptions in establishing significance.