
Process Variation Analysis is the lifeblood of Lean Six Sigma analysis. The whole aim of the game is to ensure that our process systems, whether they are service oriented or product oriented, are in control and capable. If there are any deviations from a preset process design value, then corrective action should be taken to restore that system back to normal. In order to determine how a system is performing, critical process ratios are calculated in order to determine to assess the system’s efficiency performance.
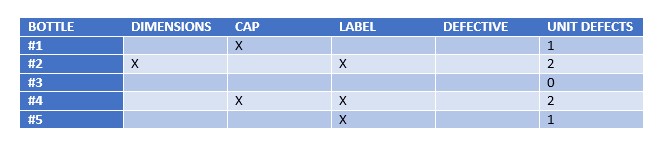
DPU, DPMO, PPM and RTY are a few process assessment criteria, that are used to determine the baseline performance of a system. When analyzing batch or continuous processes, these ratios will help process analysts to use statistical terminology to determine the quality of a process. Let us use a simple water bottle operation to determine whether or not our process is in control and capable. The process parameters highlighted in the headings will be assessed per bottle. For a batch of five bottles, the following are the results.
If three main criteria are utilized in the assessment of the bottle quality of a finished product, the following analysis of the system can be executed.
DPU: DEFECTS PER UNIT
The total defects per unit, is determined as an average value, and is calculated by the formula:
DPU: TOTAL # DEFECTS/TOTAL # OF UNITS
Assessing our bottling operations above, we see that there are 5 bottles produced in a batch. The three quality criteria focused on:
1) Bottle dimensions: Were the bottles manufactured correctly, since they are made onsite from PET pellets?
2) Bottle caps: During the filling process, where the bottle caps fitted properly in order to facilitate the appropriate sealing of the water? This is a critical quality and public health safety standard.
3) Bottle labels: Were the labels fitted properly. Image is everything in the food and beverage industry.
Assessing the DPU = 6 total defects/5 total units = 1.2 defects per unit, taken as an average of the batch.
DPO: DEFECTS PER OPPORTUNITY
The defects per opportunity measures the probability of defects being generated by a system. Three parameters are integrated to facilitate this calculation:
The # of defects per unit: DPU = 1.2
The # of defect opportunities = 3
DPO= DPU/O = 0.3
There are more than one formula for calculating the DPO, but this is the simplest. All give the same result, so once you know one…you know them all.
DPMO: DEFECTS PER MILLION OPPORTUNITIES
This parameter, known as the defects per million opportunities, calculates the probability that a process’s defect probability per million units produced.
DPMO = DPO X 1 million
DPMO for the bottle manufacturing process is calculated as:
DPMO = 0.3 X 10 6 = 300,000
This figure is a just a probability of failure. If the process number falls out of the three standard deviation band, settle down with your team…and simply execute a detailed root cause analysis, run your six box analysis and prioritize your high priority actions, and work on reducing the probabilities of occurrence. If the bottle labels are out of control, assess your system to figure out why the quality of labelling is low.
PPM: PARTS PER MILLION
This parameter calculates the actual quantity of defective bottles or units, per million units produced. The formula is:
PPM = Defectives Percentage x 10 6
Assessing our bottling process, we see that 4 out of the 5 bottles are defective. A perfect bottle is one with zero defects. In this instance we find ourselves at 80% defective.
PPM = 80, 000 = 0.8 x 10 6
The aim is to keep this number within the six sigma bands in the initial outline. If there’s a trend towards the outer limits, or the numbers exceed both extremities, once again resort to a root cause analysis for a correction implementation strategy.
RTY: ROLLED THROUGHPUT YIELD
This parameter is a determination of the process efficiency. It is the number of perfect units produced in each process pass.
RTY= # of PERFECT UNITS/ # UNITS
From our batch above, we have identified at 1 out of 5 units in our batch, are with zero defects. This equates to 20% of our production output. 80% has to be re-worked. Our process requires a lot of rework, so the team will have to identify the points of failure and execute a root cause analysis.
CONCLUSION
Utilize these key ratios for an ideal process performance.