
As human beings and organizations, we are all on a continuous quest to better ourselves. Perfection is a standard that we all seek. Alas, there is no perfection on a day to day basis, but overtime, a suitable average standard can be identified.
This is the nature of process control. In the quality realm, the ideal process performance standard are met, when a process performance varies randomly around a pre-determined design mean. Typically, quality parameters are agreed upon via discussion with the end use customer, and all the preceding process steps are designed to meet the appropriate criteria.
In the alumina industry for instance, high silica in the product output has significant impact on downstream smelter use. As a base component in glass, silica has a high melting point, which affect smelter electricity usage, and ultimately, the final aluminum sheet metal price.
In order to satisfy customer requirements, alumina refineries, which provide smelter feed, have to ensure that their process extracts the maximum alumina from the incoming ore, or else they’ll either lose customers, or drop their price to sell a sub-standard product.
Quality systems, work off eight main dimension when it comes to determining the end customer’s needs are satisfied. These criteria include conformance, performance, features, reliability, durability, serviceability, aesthetics and perceived quality.
Depending on whether or your not you’re a service or a product manufacturer, there will be a variation in the parameters that are critical to quality. When talking to your customers, sit down and identify what parameters are critical to your quality determination and design your process to meet those predetermined criteria.
This discussion was initiated by identifying that silica content is a critical quality enabler for alumina smelters. The less silica the better. In the negotiations with alumina refineries, the customer will give the alumina refinery a target silica number in the final alumina product.
The alumina refinery, will then assess its process, and identify what process conditions in the extraction process will determine this final outcome. Once the process is designed to meet the final criteria, process engineers and process analysts continuously monitor the process in order to determine whether the process is control and capable.
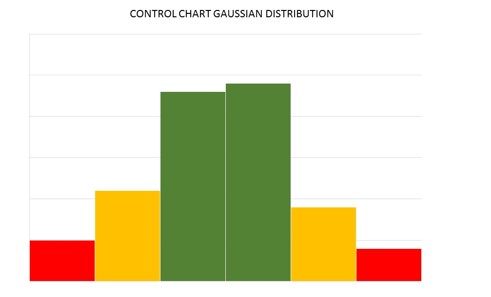
The use of Gaussian Control Curves is the ideal means via which, process analysts can determine if a process is in control or not. From the image above, we identify three pre-determined zones that a process is operating in. In the middle of the two green bars in the curve, lies the mean value, or the customer’s target set point.
The green zones are exactly one sigma, or one standard deviation away from the mean in value. The orange/amber zones are two standard deviations away from the mean, and the red zone are three standard deviations away from the mean. Anywhere outside of the red zone will either violate customer requirements, or be an overwork of the process beyond standard expectations.
You don’t want to violate either threshold, you want to stay as close to the mark as possible. With any process, there is no perfection. Feed conditions will change, heaters will foul as the process continues and affect your temperature outputs, and impact your final silica numbers. These changes impact what is known as the process variation. It is expected that the process performance will change over time.
As long as the deviations are within the three standard deviation band, the organization can guarantee its quality output. Outside of this sphere…corrective action such as a heater change, or feed condition adjustment, or blending with higher quality product at the end of the process, will be required to render the product back to normalcy.
Waste is unwanted in process operations, so ensure that you are designing your system to sustain quality from the first pass.