It is used for variables of different levels of measurement, including the Lower level, which are nominal. It Is Used to determine whether the data obtained from a single sample show statistically significant variations in the null hypothesis.
When we formulate a working hypothesis, we simultaneously define the null hypothesis, which denies our work hypothesis. According to the null hypothesis (H0) Variations in the independent variable do not correspond to the variations that may be in the dependent variable. That is to say that there is “statistical independence”. The variations that could be found should be random factors outside the independent variable.
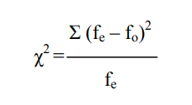
To check if this is so (and therefore we should accept H0) or not (and, Consequently, reject it), we can submit the results obtained from our sample to a Chi-Squared test, which is postulated with the following equation:
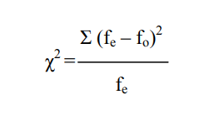
This Is the ratio between the sum of squares of the differences between the expected frequencies (fe) and the observed frequencies (fo) with respect to the expected frequencies (fe). As any reason, it expresses a proportion; In this case, the ratio of observed distances (elevated to square) and expected frequencies.
But the application of Chi squared cannot be done directly. It Is necessary, before that, to take two steps. On the one hand, to establish the level of significance (ά) with which we will work, and determine the degrees of freedom of our sample.
The level of significance is arbitrary and is fixed beforehand (usually between 0.01 and 0.10, being the most used that of 0.05).
Degrees of freedom are established in function of the number of cells that we have, product of the categories of a variable or the amount resulting from the crossing of two variables.
Degrees of Freedom
This notion refers to the possibility of establishing, in a distribution arbitrary values without modifying the marginal of that distribution. Thus, in a variable with five categories, I can set four values arbitrarily, as that the fifth will be determined by the difference between the sum of the four that I establish, and the marginal. When I have a variable, the formula for calculating degrees of freedom is
Being “K” the number of categories I have.
Chi-Squared Test for More than One Sample
When working with double-input boxes (two variables), the categories of the independent variable constitute, each, a sample. For example, if the independent variable is sex, I will have a sample of men and another of women. In these cases, the way to establish degrees of freedom is
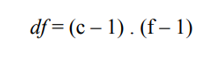
Being “c” the number of columns and “f” the number of rows.
That is to say that it is the product of the number of cells minus one, by the number of rows minus one.
Calculating the Expected Frequencies
The expected frequencies (fe) are given by the null hypothesis (Ho), but not always it can be set up immediately. This is only possible when we work with a variable, but when we have double input boxes how to set the expected frequency value of each cell is as follows:
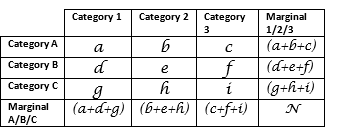
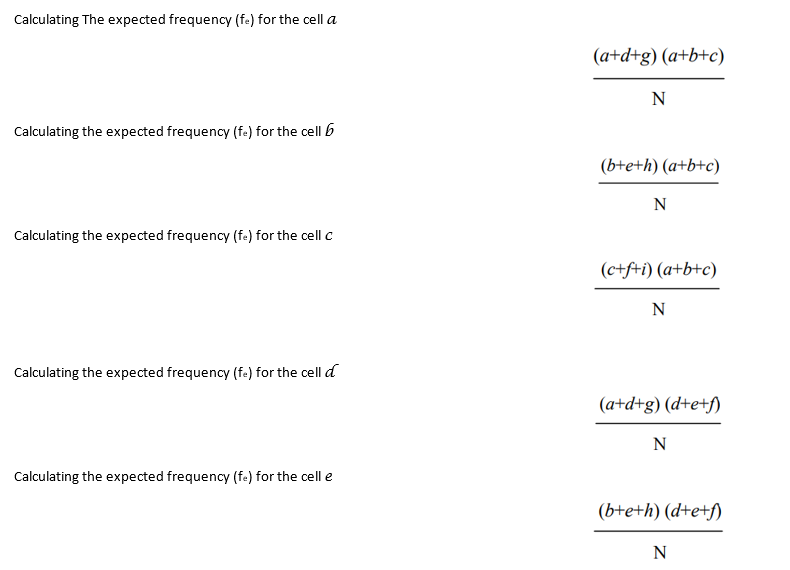
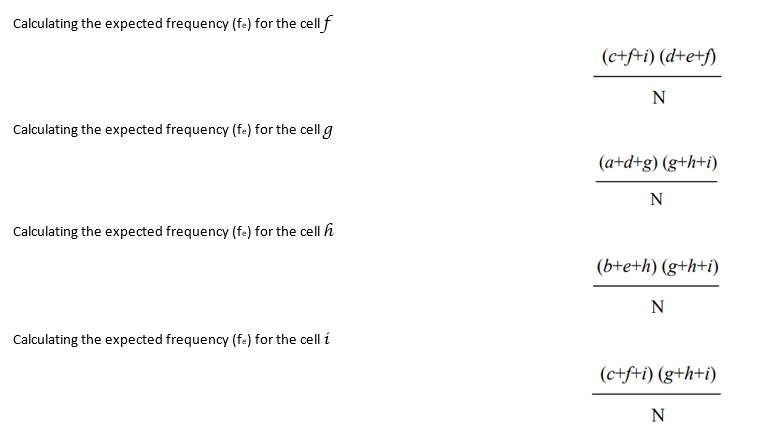
As can be seen, the procedure is very simple. It’s about the reason between the product of the marginal of the considered cell and the total (N).
Comparing the Value Obtained and Reading the Chi-Squared
Once you get the result of the equation, the number thrown has no meaning on its own. Actually, the obtained is a parameter to establish the validity or not from my work hypothesis. If you look at the Chi-Squared formula.
It can be noted that the greater the difference between the observed frequencies and the expected (fo and fe respectively), the greater the numerator will be ![]() and, as a result, it will also be a larger number. A greater difference indicates, by the other hand, which is less likely to be purely random (which is what that would indicate the Ho). For this reason, the higher the number obtained, the more likely is that we can reject the null hypothesis.
and, as a result, it will also be a larger number. A greater difference indicates, by the other hand, which is less likely to be purely random (which is what that would indicate the Ho). For this reason, the higher the number obtained, the more likely is that we can reject the null hypothesis.
We said that the number obtained is simply a parameter, that is to say, a point to compare. And What should we compare it against? Against table D, which is the Chi-Squared distribution. For this we must consider the degrees of Freedom ![]() and the level of significance (ά) we have chosen. In the column heads of table D we find the levels of significance, and in the ranks, the degrees of freedom. Crossing Both (column and row) we reached a cell with a certain number.
and the level of significance (ά) we have chosen. In the column heads of table D we find the levels of significance, and in the ranks, the degrees of freedom. Crossing Both (column and row) we reached a cell with a certain number.
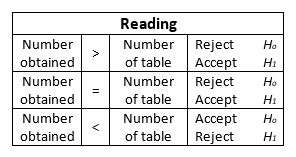
If the number we obtain by calculating Chi-Squared is equal to or greater (= or >) to the one listed in the table, we reject the null hypothesis (Ho) and validate, consequently, our working hypothesis (H1). If, on the contrary, it is inferior, we must accept the null hypothesis (Ho), being invalid our work hypothesis (H1).