
An icon character in the field of quality was made before the same question. The function of a check sheet varies according to the type of sheet. This is what Kaoru Ishikawa says:
- To Quantify product defects
- To quantify faults by location
- To quantify defects due to cause (machine or worker)
To track the activities of a process (checklist) so the check sheet is an entry door for other quality control tools. Without data, there will be no solution, hence its importance.
Types of Check Sheet
There are no established types of check sheets in a formal way, however if we can define certain common uses, which are summarized in three:
- Data record Sheet
- Check list Sheet
- Location Sheet
Some examples are:
Check Sheet with Measuring Scale: With It we evaluated the probability distribution form to build a frequency distribution. In this type of sheet we classify the measurement according to a series of categories or parameters, in addition it allows us to trace limits of specification.
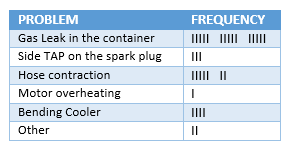
Frequency Check Sheet: With This sheet we define the categories and collect the data, noting the number of times that are presented.
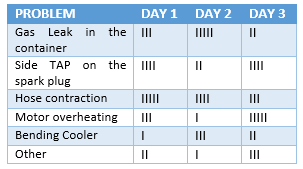
Check Sheet with Classification: Also called verification sheet by type of defect. In This sheet, we define a series of categories to be located in the first column and in the first row, in such a way that the gathered data are classified according to the intersection of column and row.
Location Check Sheet: It presents one or more diagrams of the measuring object, in which we indicate the location of the defect.
Checklist: The aspects to be checked are enumerated and listed in such a way that when an event is detected associated with one aspect, it can be marked as appropriate.
How to Make a Check Sheet
There is no defined way to make a check sheet. This will depend on the situation to be analyzed, so everyone is responsible for designing their own sheet. However, there are some guidelines to be taken into account to achieve our verification sheet, let’s see what they are.
Step 1: We Set the context on which we are going to measure the data. Basically What we do here is to plan, and one of the best tools to support us is the 5w + 2h.
- What
- Why
- When
- Where
- Who
- How
- How much.
Step 2: We Create the format of the sheet, which will be designed according to the 5w + 2h of the previous step.
Step 3: Collect the data. It Is important that the data be collected as defined in the how, when, and where in step 1. Thus we ensure the relevance of the data collected.
Sample Check Sheet
“XYZ” is a business that provides technical service to computers. The owner has decided to characterize the type of errors that are presented, their frequency and the number of errors that can be solved by a technician for a period of time. Let’s see how he did it.
Step 1:
What: Classify The defects of have the clients in their computer and the effectiveness in the solution by the personnel.
Why: Provide a better service according to the type of defect and train new personnel in the most frequent defects.
When: Data will be taken for three weeks.
Where: The data will be taken in the repair room.
Who: The data will be taken by the product engineer and three technicians will be evaluated.
How: The data will be taken through check sheets, according to the following classification:
- A cross: Flaws in the Board
- A circle: Defects in the Monitor
- A triangle: Ventilation Flaws
- One x: Software or virus Flaws
How Much: The data Will Be taken from 50 clients or until the stipulated time is fulfilled.
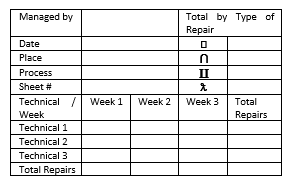
Step 2:
Look at the defined in step 1. We require to classify data according to the week, the part of the computer and the number of services provided by each technician. We can adapt various types of check sheets. How about this?
Step 3:
And This is what the format looks like. With this we can determine the number of services according to the defined classification, how many services did each technician and the week in which they did.
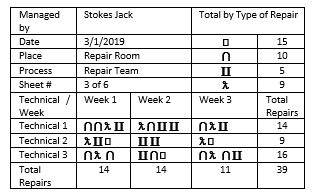
With This data we can already make respective decisions or to advance other studies with other tools of analysis and prioritization of problems. For example:
- Why does Technician 2 not have the same performance as Technician 1 and 3?
- How long does it take to make repairs for each type?
- What can I do to make monitor repairs faster?