
Stratification is to classify or group data with matching characteristics in groups or strata. It serves to facilitate the work before using other tools such as histograms or scatter diagrams.
When there is a lot of data, for example, in a scatter diagram, its interpretation can be quite complicated and the problems to be detected can be masked. This technique separates the data so we can find patterns that otherwise could not be seen.
When to use stratification?
- Before collecting data: Sometimes we have a lot of data and it is convenient to try to classify them before launching ourselves to use another type of tool such as Pareto diagrams or Histograms.
- When we have data from various sources or conditions: shifts, days of the week, suppliers or population groups.
- When data analysis requires the separation of different sources or conditions: for example, separate by different equipment.
Types of stratified sampling
Depending on the size of the strata, we can find 3 types of stratified sampling:
1. Proportional or proportionate stratified sampling
The sample must have strata that have the same proportions observed in the population.
For example: We are analyzing the number of freelancers in Spain who work from home and there are 1,000,000 people in this segment: 70% of women and 30% of men (these are totally fictitious data).
If we decide that the sample is 1000 people, the proportion should be as follows:
- Women’s stratum: 700 (70%)
- Stratum of men: 300 (30%)
2. Uniform stratified sampling
When the same sample size is assigned to all the defined strata, regardless of the weight they have in the population. If we continue with the previous example, a uniform stratified sampling would be as follows:
- Women’s stratum: 500
- Men’s stratum: 500
3. Optimal stratified sampling (with respect to the standard deviation)
In this case, the size of the strata in the sample does not keep proportionality with the population. The size of the strata is defined proportionally to the standard deviation of the variables under study. That is, larger strata are taken in strata with greater internal variability to better represent the population groups that are most difficult to study in the total sample.
What type of sampling is the most convenient?
- Proportional stratified sampling always produces less or equal sampling error than simple random sampling.
- Optimal stratified sampling is always the same or more accurate than proportional stratified sampling.
Stratification procedure
Before collecting data, you should consider what information about the sources of the data can have an effect on the results. What are you going to analyze?
- Collect the data.
- Determine the stratification factors to be employed.
- Make the necessary calculations to divide the strata.
- Graph the collected data in a scatter diagram, control chart, histogram or other analysis tool. Use different brands or colors to distinguish data from various sources.
- Observe and analyze the results.
Example
We will take as an example a soap factory.
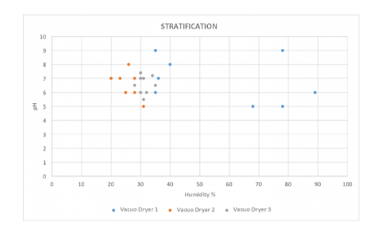
A soap manufacturing company detects that the moisture% of the soap shavings presents anomalous values when it is related to the ph. After making a scatter diagram, the data obtained does not seem to shed light on the problem. The technologist of the plant proposes to segment the data obtained taking into account that 3 different vacuum cleaners are used to dry the soap. The data shown is totally fictitious.
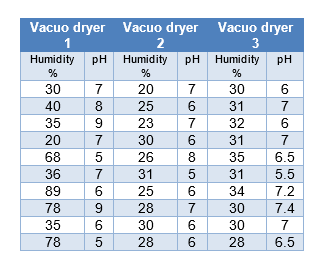
From these data, we can make the following graph, which clearly shows that the vacuum cleaner 1 can have a problem that a priori had not been detected:
Advantages of Stratification
- It allows to isolate the cause of a problem, identifying the degree of influence of certain factors in the result of a process.
- The stratification can be supported and serve as a basis for different quality tools, although the histogram is the most usual way to present it.
- Stresses that the understanding of a phenomenon is more complete.
Phases of application of stratification
- Define the phenomenon or characteristic to analyze.
- In general, represent the data related to this phenomenon.
- Select the stratification factors. The data can be grouped according to time (shift, day, week, seasons, etc.); of workers (seniority, experience, sex, age, etc.); machines and equipment (model, type, age, technology, tools, etc.); or materials (suppliers, composition, expedition, etc.).
- Classify the data in homogeneous groups according to the selected stratification factors.
- Graph each homogeneous group of data. For this you can use other tools, such as histograms or Pareto analysis.
- Compare the homogeneous groups of data within each stratification criterion to observe the possible existence of significant differences between the groups themselves. If we observe significant differences, the stratification will have been useful.
The behavior, opinion or data of each of the groups or variables that intervene in a given situation must be studied. The knowledge of these data in the exposed form, that is, stratified, will allow assessing the convenience of adopting certain actions.
Stratification is used to identify the causes that have the greatest influence on the variation. Understand in detail the structure of a group of data and examine the differences between the average values and the variation between different strata.
It is applied when raising data collections and in the analysis and representation of the data by means of Pareto diagrams, histograms and correlation diagrams.