
What does standard deviation tell us?
Standard deviation (StDev) plays an important role for any process improvement, under the guidelines of a six sigma approach or quality initiative since is a measure of variability, smaller it is, closer the data are disperse around the mean. The mean could be any expected value or target. In short, standard deviation tells you how far the measurements deviate from the mean.
For example, corrugated board is a material that is used for the packaging of food as used to stack heavy products over a pallet. Thickness is an important property of combined board, and a high variation in thickness could affect the performance of the material. Below are two histograms that represent sixty measurements (n = 60) of thickness measured in thousandths of an inch. Let’s say our target is 0.157 for a specific combination of paper, with a lower specification limit (LSL) of 0.154 and an upper specification limit (USL) of 0.160.
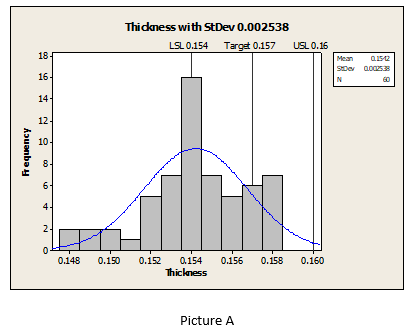
Histogram of picture A represents a process with mean of 0.1542 and a standard deviation of 0.002538. This tells you that the process mean is below target and on average; measurements differ from the mean by +/- 0.002538. We could say and proved by the bell shaped curve, which is a little skewed to the left, that our measurements are scattered 2 StDev above and 3 StDev below the mean of 0.1542. Clearly, something is reducing thickness and increasing variation. It could come from many sources; machine, materials, manpower, measurements, environment and methods. Therefore, considering specifications’ limits, this process is incapable to meet customers’ requirements.
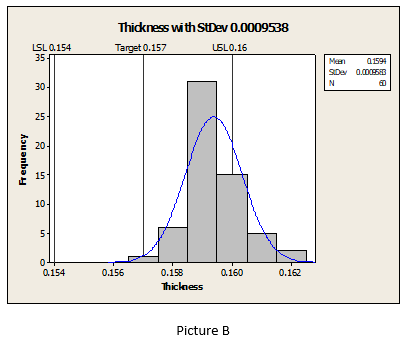
Picture B shows a process with mean of 0.1594 and standard deviation of 0.0009538, after process has been improved. Machine was repaired, material strengthen, manpower trained and instruments calibrated. As we can see, the process mean has shifted from 0.1542 to 0.1594 and StDev reduced from 0.002538 to 0.0009538 as a result of process improvement. Now, measurements differ from the mean by +/- 0.0009538. Although the left tail of the curve is almost the target, 0.157, if we see our LSL of 0.154 and USL of 0.160, this process is highly capable to meet customer’s requirement due to reduced variation. Depending of the customers you serve, market segment, uses, etc., higher thickness is a desirable attribute on corrugated board.
For instance, when we need to measure the spread of data around the mean, the standard deviation provides such measures. It tells you how far the measurements deviate from the target; it tells you if your improvements efforts are working. Today, StDev can be easily calculated by software applications, scientific and most business calculators.