
The Pick Chart is a tool to select the different solution alternatives, based on the weighting of options and the application of criteria.
It is a key instrument for making decisions and classifying problems. It teaches us how to be more productive at work and how to make important decisions. And it helps us to define the causes and effects of problematic situations to apply more accurate strategies. Remember that any problem can be understood as a gap between reality and the desirable situation.
Well, to make a Pick Chart, before we have to identify the different alternatives and decision criteria, in order to put everything in common and opt for the solution that better weighting obtains.
Benefits of Using a Pick Chart
When unforeseen or last-minute problematic situations arise in our projects, it is convenient to stop, analyze the situation and determine possible solutions. In this process, it can help us a lot to know how to make a prioritization matrix, an activity that we should include in the planning process.
In project management, there are many advantages that we can apply with this tool. We identify everything you can gain if you apply this Pick Chart in crisis situations or blocking moments in decision making. We identify everything you can gain if you use the problem Pick Chart in process and project management:
- Effective solutions
- Valuation of expectations
- Identification of selection criteria
- Exploring different alternatives
- Proven solutions under the same criteria
- Identification of risks
- Possibility of applying project simulations stored in your application
- Flexible plans oriented to the real requirements
How to Make a Pick Chart?
Many companies use this Pick Chart when they need to solve complex problems. They summon all their team for it and use the daily activities agenda to inform all the collaborators. These are the steps to know how to make a Pick Chart:
- Identify the main problems in a generic way.
- Formulate in a sentence the central problem. This point is fundamental because we clearly describe the objective that we pursue when we perform.
- What are the causes of the central problem? This will help us to define the different options to give a more precise solution to the problem.
- What are the effects caused by the central problem? This will also allow us to prepare a list of precise solutions.
- Identify the resulting options or solutions. We make a list with the different alternatives that we discuss on the table. It may be that we already have it and this step only helps us to choose one. If not, it is advisable to work as a team to propose creative and enriched alternatives among all collaborators.
- Preparation of selection criteria. It is time to establish the connection with fundamentals that relate all the options listed above. What is important that each solution meets? These criteria must be defined very clearly and without misunderstanding. All team members should know what each one refers to.
- Weight the criteria. Time to give an impartial assessment to each criterion. We will use an L-type matrix for this, as we can see in the image below. We start from a vertical axis, where the different criteria are placed. Each time we give a numerical valuation to each criterion, we fill in the same criteria for each solution. In the process, we compare each value with the others.
I will explain, an example, that we can find in a company, where it has implemented the ISO 9001: 2015 standard, and to comply with the standard must meet the requirement to plan the training of workers. It has been proposed to train its workers and should choose the most appropriate courses, but how can we know what to choose?
In a company, the Management together with the Human Resources department want to choose some training courses, to improve the efficiency of their commercials, for this they inform themselves and get 4 options:
- Training course on applied market studies.
- Training course on how to improve telephone sales.
- Customer service training course (general).
- Training course on technical knowledge of the product to be sold.
The company is dedicated to the sale of specific laboratory machinery, so that customers or potential customers are highly trained people and what they know what they are looking for.
To decide which course is the most appropriate and which will be most useful for your workers, they decide to make a prioritization matrix to know which option is the most appropriate for your company.
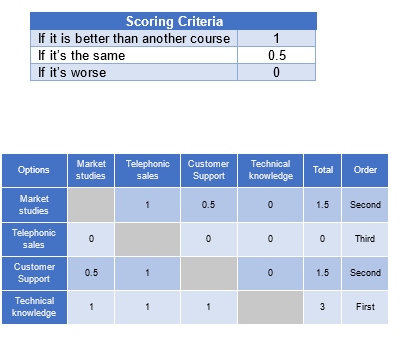
To be able to compare each course with the others we establish a simple criterion, in which if it is better we will score it with 1, if it is worse with 0, and if it is equal with 0.5.
The Pick Chart would be as follows:
Where:
- First of all we cancel the cells that intersect with the same options. In this case I have marked it with orange color. It does not make sense to compare a course with yourself.
- Subsequently, we give priority to the rows, and begin to score, as follows:
We are going to fill in the first row:
- The first box of the matrix is canceled.
- The second box we have to ask ourselves: the course of market studies is better, worse or the same as the telephone sales course. In this case, it is clear that as potential customers and our salespeople are very specialized in the product, the sales system does not work for calls, and therefore, the telephone assistance course does not work. Therefore, the market study course is better than the telephone service course. We look at the table of scores and it corresponds to the value 1.
- The third box, the course of market studies is better, worse or equal to the customer service. Due to the content of the course, we decided that the same, therefore we assigned a value of 0.5.
- Finally, in the fourth box: the course of market studies is better, worse or equal than acquiring more technical knowledge of the product. In this case, as we have said before, the sector is very specialized, and increasing the technical knowledge of our salespeople can help them to answer possible doubts from customers, and make their decision to buy the product. Therefore, the course of market studies is worse than acquiring more specific knowledge of the product, and the valuation is 0.
The same as I have done, for the first row of the matrix, it must be done with the other three until it is completed.
Subsequently, all the values of each row are added. The highest value, according to our criteria, would be the best option. In this case, it is the acquisition of more technical knowledge of the product.
As you will see, this example is very simple, but it can be applied to more complex cases and with more variations. In complicated decisions, you can help us visualize which option is the most appropriate.