
The importance of quality in industry cannot be stressed enough. With increasing competition, as well as higher standards from the customer perspective, it is of the utmost importance for organizations to maintain consistent quality in their product or service delivery. Processes are not perfect, there will be various factors that influence the outcome of the product or service that is delivered to the customer.
For a given process, over time as the system stabilizes, it is possible for the organization to quantify their defects, and implement processes to keep those defects at bay via suitable reaction plans. With the appropriate reaction plans, companies can rest assured that their product quality is of a repeatable standard. Statistical tools exist to facilitate the appropriate analysis of a system. As with all tools implemented in the Plan, Do, Check, Act cycle, there are means via which the percentage of defects to the percentage of acceptable product standards are compared.
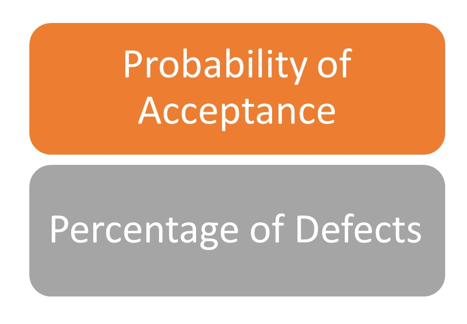
The tool of choice for product quality versus acceptance is the Operating Characteristic Curve. Organized similarly to a Gaussian Distribution Curve, the Operating Characteristic Curve is a plot of the Probability of Acceptance (on the Y-axis) to the Proportion of Defects. Organized as a decay curve, the higher the Proportion of Defects experienced by the process or system, is the lower the Probability of Acceptance of the product or service by the organization.
Organizations optimize their systems therefore to facilitate the minimum level of defects in their operations. Chemical Process Systems are ideal examples for the assessment of the different elements of the Operating Characteristic Curve. The first element for assessment is known as Acceptance Sampling. For a production run, assuming a 24 hour day, there will be various elements that result in a process either remaining on its quality critical targets or deviating from these objectives. The aim as an organization is to determine how much variation the organization is willing to accept in order to satisfy its quality standard. The norm is that statistical variation will take place in the production process, so the quality management team of an organization will have to identify the sources of defects, as well as incorporate the appropriate buffers for the change. Acceptance sampling achieves the target of determining the current condition of a system, so that corrective actions can be taken if necessary.
For chemical processes, periodic sampling is implemented. Each shift, a target number of samples can be implemented for analysis. Utilizing graphs containing the target parameter, an upper limit and a lower limit, it will be possible for the system to identify whether or not the current sample is upholding the organization’s standards. If it is, then the process can be left to operate as it normally does. If there’s a consistent trend either upwards or downwards towards the lower end of the range, there is a process discrepancy that is causing a shift. By consistently checking the system, the organization can determine whether or not the system is performing as it should. Sampling is one of the first step in the implementation of a quality management system.
Depending on the quality management system that the organization is currently utilizing, it is possible to identify certain critical parameters that will determine the system’s status. The Acceptable Quality Level, is utilized in order to identify if the system performance is as desired. Production systems regard re-work as very costly, so it is important for the first operating run to meet the desired target. System averages for the acceptable quality level is a deviation of between 0.1 and 2%. What the system aims to do, is maintain between these levels and ultimately sustain the quality level needed in order to satisfy its customers, as well as maintain a normal production run.
With these two parameters in place, the interpretation of the Operating Characteristic Curve is simplified. Using the sampling plan percentages as the X-axis, the customer data will be utilized in order to determine whether or not the product will be accepted by the customer. With zero defects, there will be 100% acceptance, while the odds reduce as we approach the 2% margin.
Systems go to great extremes in order to ensure that their quality is as desired. The quality levels of an organizations are usually built into their very operations. Quality standards are established by the customer in a charter that outlines the Voice of the Customer. This charter is then converted into a series of process steps that facilitate the delivery of the customers desires into a tangible product or service. The Operating Characteristic Curve, is the means via which systems can utilize feedback tools to determine if their systems are providing the appropriate standard to their customers.