
Like PERT, CPM and AND, Gantt Chart is also a tool (A graphical tool) that finds tremendous use in the field of Project management ranging from small projects to large-scale project portfolios. It is used to sequence the activities according to the time axis and is helpful in preparing and reviewing project plan.
It was first used officially by Henry Gantt in 1910; From then on it found its use in several places including Second World War. Nowadays, no one can imagine implementing and reviewing a project without a Gantt Chart. There are applications and software tools available to plot a Gantt Chart for complex projects.
A Gantt Chart is a bar graph with time scale on x-axis and the activities marked as bars parallel to x-axis. The bars’ length indicate the duration of the activity and the start and stop points of the bar represent the start and stop dates of the activity. Often, Gantt charts have two bars for an activity: one representing the planned schedule and the other representing the actual.
When and How is a Gantt Chart used?
You may use a Gantt Chart if:
- When you want to display the activities against time
- When you want to compare the Plan Vs the Actual completion rate of the project
- When you want to know the overlapping time of parallel activities and plan the resouces and schedule accordingly
Plotting a Gantt Chart is quite simple. Here are some quick steps to help you:
- Plot the time in X axis (Start and End dates of the project)
- Plot bars of each activities in the project one below the other in parallel lines. Use the start and end dates of each activity to mark the respective bar
- Similarly plot the actual time taken for each activity (If needed and available)
- Use color indicators to differentiate various activities, and also to denote plan adherence (Green, Amber, Red etc)
Note:
- Only overlapping activities will be plotted one below the other against the same time frame.
- Length of overlapping varies according to the project plan, schedule, resource requirement etc
Below is an example Gantt chart, which will be helpful in understanding the concept better:
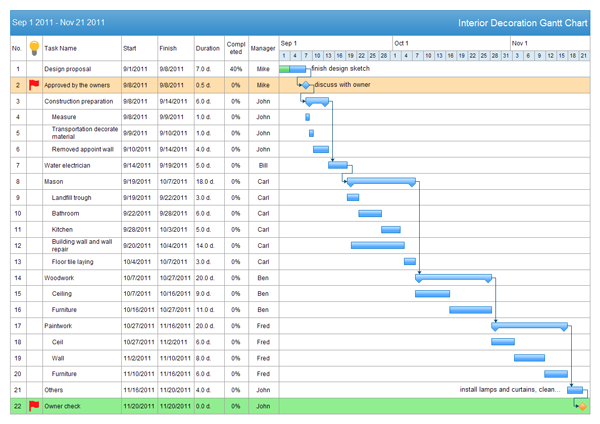
Thus Gantt chart is a simple and logical tool with a good visual impact and hence is used across the world today by Project Managers.