
People who are working on projects and in any way related to processes and projects would have been heard about this term/tool. As the name goes, Activity Network Diagram depicts the flow of various activities involved in a project in the order of time. It depicts clearly the dependencies existing between activities (i.e.: the activities that need to be completed to proceed to any individual activity) and activities that can be performed together without affecting each other. In other terms: Precedence and Parallel processes/activities.
AND is a tool that was initially used for managing construction projects, where there were multiple activities with dependencies and that could also be carried out simultaneously. So a tool that depicts the chronological order of execution of activities, as well as that identifies and lists simultaneous tasks that can be performed was required. Thus Activity Network Diagram was devised which suits the above requirements.
How to Create an Activity Network Diagram:
- First list down all the activities involved in the project
- Find out the chronological order of the activities (i.e.: Preceding activities that should necessarily be completed before a given activity)
- Find out tasks that can be executed simultaneously.
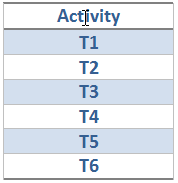
Imagine a project with the below activities:
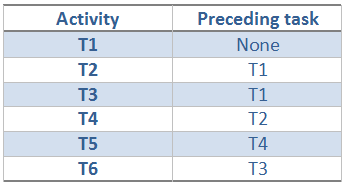
Now let us assume that the preceding activities for each activity are as below:
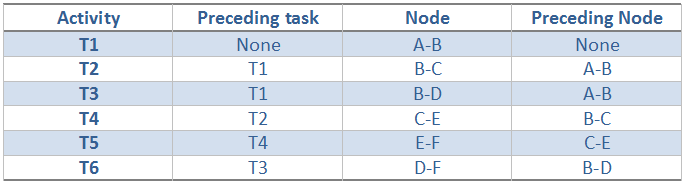
- To draw an AND, one must know that the AND is made of Nodes and Arrows. Arrows depict an activity, whereas the nodes depict the start and end of an activity. For example; Activity T1 will have two nodes A and B which depict the start and end of the activity T1. The notation A-B also indicates the task T1.
- The next activities T2, T3 require T1 to be completed. Therefore two arrows emerge from the node B simultaneously. They can be depicted as B-C, B-D.
- Similarly, T4 is dependent on T2 and T6 on T3 respectively. Therefore a single node is drawn from C and D, which are C-E and D-F depicting T4 and T6 respectively.
- And T5 is dependent on T4 and hence E-F is drawn. (Since there are no further activities, the nodes converge to a common end point.
The below table and diagram shows how the AND will look for the given example.
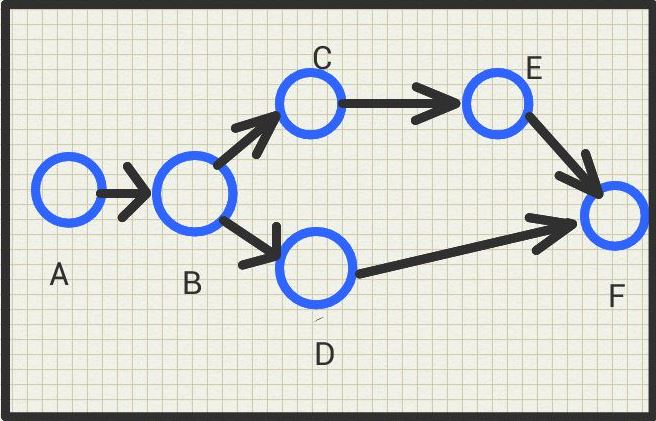 Note: There should be only a single Start and End Nodes for a project. Each task should be given unique node notations.
Advantages of an AND:
- AND is a tool much useful to pictorially depict the dependencies and opportunities for schedule optimization of a project.
- In Process management also, AND is very useful in optimizing the process time
- PERT and CPM are based on this concept of AND diagram representation for their calculations