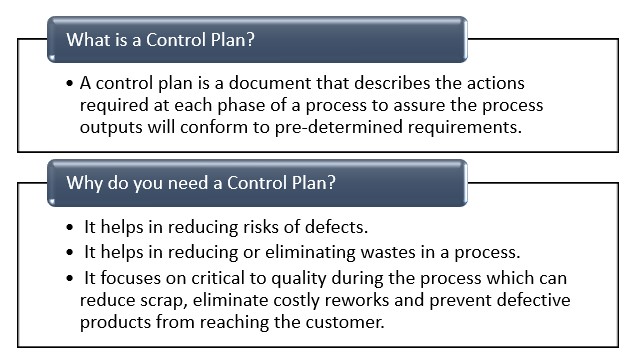
A control plan is a 14-column table designed to list all product and process inspection points needed for a defect-less outcome. This is primarily used in manufacturing, but can be adapted for other fields.

While very long and detailed, the 14 entries are pretty simple overall.
The columns are as follows:
1. Part/Process Number: The step number or part number to be detailed in this document.
2. Process Description: A clear and precise description of each process step.
3. Manufacturing Machine/Tool For MFG: Specific item and reference numbers for items needed to complete the process steps. E.g. if you’re tightening a bolt you may need ¾” Socket Wrench 163-P3M5.
4. Characteristics – Number: Number for any characteristic being monitored, usually divided into Product and Process characteristics. The former describes things about the product itself, while the latter is manufacturing techniques involved in its construction. EG a product characteristic for a char may be the length of its legs; a process characteristic may be the exact size dowel needed to join the legs together.
5. Characteristic – Product: The product characteristic from above (chair leg length) rather than just the number.
6. Characteristic – Process: The process characteristic from above (dowel size) rather than just the number.
7. CTQ?: Marked Yes if the characteristic is Critical to Quality (required for the product to be considered “good” by the customer), or No if it is not.
8-9: Product/Process Specification and Tolerance: Notes these for the characteristic being looked at.
10. Evaluation/Measurement Technique: Notes tool or method used for evaluation or measurement, e.g. “measuring tape (centimeters)”.
11. Sample Size: Notes the number in your random sampling (if any) of products on the line. e.g. if 150 products are randomly pulled off the line for testing, your sample size is 150.
12. Sample Frequency: How often (usually per shift or hour) the sample size is to be measured or studied.
13. Control Method: Notes how process control is being kept, e.g. a control chart.
14. Reaction Plan: Notes how someone is supposed to react if a defect is found; protocols for how to document or dispose (if necessary) of the deviant product.
Using this chart, you have a simple but thorough and effective way to ensure your manufacturing process remains as defect-free as you can make it. Statistically speaking, with a sufficiently large sample size (particular with manufacturing processes tuned to Six Sigma standards) you will have greater than a 99.99% chance of assuring that your control group conforms to the norm of the rest of your manufacturing output.
