
Rolled Throughput Yield (RTY) is a concept at once complex and simple. It is used to measure how many non-defective, non-reworked examples of a given product are likely to be produced based on how many iterations or process steps your product goes through.
To understand RTY, you need to understand a simpler formula for First Time Yield (FTY), the formula for which has only three variables.
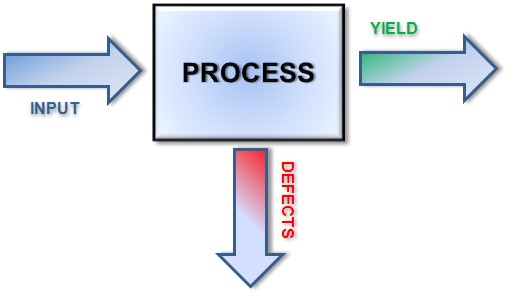
Input: The units going into any given process.
Defects: The number of defective, unusable, or otherwise resigned to scrap product units from a process.
The result of subtracting Defects from Input is the third variable:
Yield: The number of usable or non-defective units remaining after that process.
The result of this as applied across all the processes is your First Time Yield: The raw amount of completed, non-defective products.
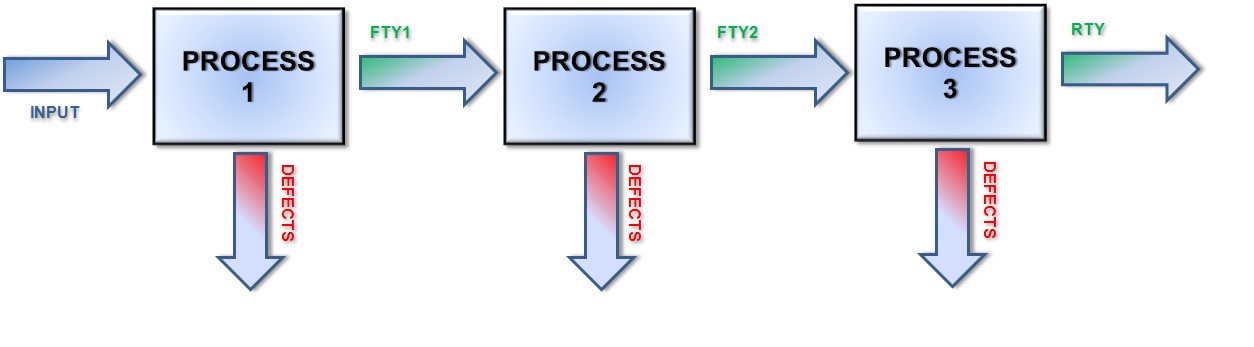
For example, if in a given process you start with 100 units, and 10 are defective, you have a yield of 90. Process 2 starts with the 90 units left over from process 1, and 5 more are lost, leaving you with 85. In a third process you lose 3 more, leaving you with a total of 82 units. This can be repeated as many times as necessary, but we’ll stop at three for now.
First Time Yield is merely concerned with the final output, ignoring all defects. You are left with 82 parts of the 100 you started with, so your First Time Yield is 82%.
Let’s organize these numbers into a table so they’re easy to keep track of:
| Process 1 | Process 2 | Process 3 | |
| Input | 100 | 90 | 85 |
| Defects | 10 | 5 | 3 |
| Yield | 90 | 85 | 82 |
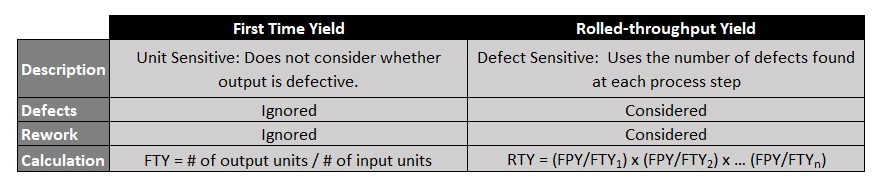
However, FTY fails to take into account two key factors: How many units were able to (and were) successfully reworked or fixed out of that amount, and what is the success rate of each step, the probability you get through it with zero defects (reparable or otherwise)?
This is where Rolled Throughput Yield comes in, adding those two extra variables.
Take the same numbers above, and then take into consideration how many units needed fixing in order follow through to the next step. What if 7 units were reworked to make the yield of 90 in process 1? 4 more to make the 85 in process 2? 10 to make the 82 in process 3? In that case, you would have a table that more resembled this:
| Process 1 | Process 2 | Process 3 | |
| Input | 100 | 90 | 85 |
| Defects | 10 | 5 | 3 |
| Repaired Items | 7 | 4 | 10 |
| Yield | 90 | 85 | 82 |
| Success Rate | 83% | 90% | 84.7% |
The repaired items themselves cost the company something to fix; they cannot be considered true successes and are therefore subtracted from the success rate of each step. You would then multiply the success rates together to get your Rolled Throughput Yield (the probability of something making it through every step unscathed), which gives you 63.2% of the product that went through without a hitch. A far cry from the 82% a simple First Time Yield would suggest.
Knowing this figure is very important for companies, because it gives a more realistic view of what their costs are going to be with a given process that simply knowing the raw output of finished product will not. After all, if 40% of your output requires revision, then costs will increase, and so will the pricing of our product need to be adjusted.
Relying on simple FTY reports is a fast track to disaster, particularly with more complex productions. What if your product required 10 steps to manufacture? 100? The RTY would steadily decrease with each new process added; no process is perfect, it’s inevitable you will lose some yield with each iteration. Costs in that case increase exponentially as a product that costs $1 to manufacture may need 40% of its product go through $.30 worth of revision before it is usable. Pricing will need to be adjusted to account for these manufacturing and refactoring costs, or profits will dwindle. Knowing is at least half the battle here, and it’s one you literally can’t afford to lose.