
Z-SCORE BACKGROUND
In any normal process operation, there will be a natural variation of data points around a central or mean value. In control and capable processes, usually have their data points varying within a tightly controlled upper and lower limit range about a pre-identified process mean, based on design calculations. If data points trend towards either boundary in a systematic fashion, and break through the barriers, then corrective action should be taken.
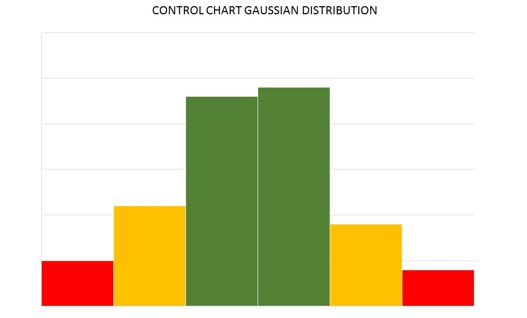
A Z-Score is a statistical measure of process variation, which focuses on the number of standard deviations away from mean value, a data point under analysis is found to be. In the graphic above, the center of the green zone is the representative of a mean value, the green zones on either side of the central value represent one standard deviation.
The orange/amber zones represent two standard deviations away from the mean, and the red zone represents the upper limit or extreme lower limit, and represents three standard deviations from the mean value. Tightly controlled processes under Six Sigma Methodology operate under such regimes.
Any system beyond this, would generate greater than target waste, and more than likely be beaten by external competition. The Z-score values then range from a negative 3 standard deviations, to a positive 3 standard deviations.
HOW TO CALCULATE THE Z SCORE
The basic z score formula for a process sample is calculated as follows:
z = (x – μ) / σ
Where z represents the z score (to be determined), x is the data point under analysis, mean (μ), and (σ) is the process standard deviation. Let us assume that we wanted to assess the exit temperature of a process heater to determine if it was time for maintenance. If the target exit temperature for a process heater was designed to be 150 F, and when the process is assessed, the heater exit temperature is being found to be 160F. If the standard deviation is 5, utilizing the formula above:
z = (x – μ) / σ
= 160F– 150F / 5 = 2
The heater performance is better than target, indicating that the heater is still clean. According to our calculation, we are finding ourselves at 2 standard deviations away from the mean, or in the amber zone of the Gaussian Control Chart that we initially assessed. If the heater temperature was at 140, we would take the absolute value and arrive at the same conclusion.
In heater care, using the Z-value, it will be possible to determine the heater cleaning frequency. Heater shells and inner tubes get fouled over time. If daily temperatures are taken, over time the process exit temperature decline can be calculated.
Once the critical heater exit temperature exceeds the 3 standard deviations, process operations would know that it is time to take the heater out of service, and either run a spare for maintenance or shut down the process for maintenance activities. This calculation pertains to a single data point.
Standard errors are used to calculate the standard deviation of a pool of samples. The formula for multiple samples is a modification of the original Z-score equation. The formula becomes:
z = (x – μ) / (σ / √n)
Where Z is the z-score, x= sample mean, μ = process mean, σ= process standard deviation, and √n represents the square root of the number of sample points. Once again, you want to ensure that your sample points fall into the +/- 3 standard deviation margins to ensure that your process is in control and capable.
For initial calculations, a manual calculation can be executed, in order to understand the critical variables at play. With a suitable controlled process, these values can be generated by process analytical software, or automatically calculated by a pre-determined spreadsheet.