Sometimes analyzing the causal relationship of a series of elements or variables can become a difficult task. Tools such as Ishikawa’s diagram can accomplish this task, however, and in the face of complex situations, it is better to use one of the 7 new quality tools, the relationship diagram.
We can define a relationship diagram as the tool that will allow us to analyze the links of the causes and effects of a problematic situation when presented in a complex way. Basically what we do is organize (without apparent structure because of the complexity in relationships) a series of elements (opinions, findings, perceptions, ideas, aspects, etc.) through the causal connection they have with each other.
What we’re talking about when we refer to “Complex Form”
Tools to analyze causes and effects there are several, why use the relationship diagram then? It Is because of the relationship of complexity that may exist between the causes.
For example, imagine an effect or consequence that is caused by three causes, but two of these three causes have each two different effects and in turn one of them is the cause of another effect. Translating this approach into a cause and effect diagram can be difficult, which is why the relationship diagram, in addition to allowing us to determine, allows you to classify and prioritize the elements of a situation or element of analysis.
Advantages and Benefits: Why use the Interrelationship Diagram.
- It gives you a visual (for some disordered, it is true) of the causes and effects around an element object of analysis.
- Unlike other tools, this tool gives you more ease to represent complex connection structures, which can be very beneficial when faced with quality control challenges.
- You get to analyze the interrelationships between elements, ideas, perceptions, topics or opinions.
- It Is complementary to other tools of quality and continuous improvement like the affinity diagram to give continuity to the consolidation of information or to the diagram of fish thorn or of tree to deepen in the exploration of the causes.
Relationship Diagram Types
Your diagram can be of different type depending on the center from where it begins to develop or the relation cause-effect that maintain. There Are 3:
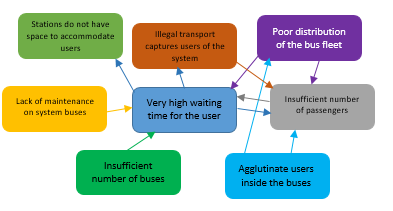
- Converging Central: The diagram is developed from the center. It is more useful when the problem or subject studied has many causes.
- Directional Intensive: The development is given from one direction (right, left, up, down). In this case the central theme has few causes.
- Relationship Indicator: Establishes links between elements without having specific cause-effect connections or with the absence of a defined center.
How to make an Interrelationship Diagram
Make Sure you have:
- Sticky Notes or papers with tape.
- A space with table or board.
- A task force that knows about the situation analyzed.
- Pens and Markers.
Step 1: Declaring the situation
Write a statement of the situation that will be analyzed. This may well be a cause, an effect or a problem. You can write it on a sticky note (post-it) or directly on the blackboard. I personally like to write it in the center, but you can write it up or on one side. The place where you do it, will be the origin of the connections.
Step 2: The Time of generation
In Step 2 you will generate the elements or ideas on the subject. There are two paths depending on the starting point:
- Interrelationship Diagram as a complement to another tool: If You first made an affinity diagram, take the ideas before generated; If it is a tree diagram, the branches of the last level, and if it is an Ishikawa diagram the thorns of the last level of detail. Then as an optional step, consider doing an additional brainstorming session. Something new Might come up.
- Brainstorming: If you didn’t use any cause-analysis technique before, use any method of ideation such as rain ideas to generate elements around the central element; the one you already placed in the center of the blackboard. The members of the group will write each idea or element on individual cards.
Step 3: Making connections
Take an item and place it on the blackboard or on the table. As A team, plantéense the question:
Does this element cause or influence the central element? Why?
Does this element cause or influence another? Why?
If the answer to the first question is positive, place the card near the central element and draw an arrow from it.
Now analyze the second question and if it causes other elements, empty and trace arrows that point to the elements that are caused by the item you are analyzing.
In case you do not cause any other, do not trace any arrows. Your time will come.
Then take another card:
Does this element cause or influence the central element? Why?
Does this element cause or influence another? Why is that? (Here it includes both the elements you have on the board and the ones you haven’t placed yet)
With the same criterion, it starts to draw connections. If a card causes the central element, try to place it closer to the center (or from where the diagram is originating), otherwise put it farther away. This is not to be so, but it will help not to entangle both the diagram with arrows that intersect with each other.
Repeat this procedure until you have hit all the cards.
Step 4: Adjusting the diagram
Adjusts the relationship diagram. Review the connections and change the cards if you think the initial ordering can be improved.
Step 5: Let’s make an account
Analyzes:
- Count the number of input and output (Input/output) arrows on each card and annotate it in one of its corners.
- If a card causes many others: These are the main causes.
- If a card is touched by many arrows: it represents final effects.
- Those cards that concentrate a lot of incoming and outgoing arrows: They are key elements.
Also analyzes those cards that do not enter any of the previous groups, do not necessarily need to have incoming and/or outgoing arrows to be important.
With this you have completed the relationship diagram and there is no more to make decisions from their findings.
Interrelationship Diagram Example