
The cost-benefit analysis is the process of placing figures in dollars in the different costs and benefits of an activity. By using it, we can estimate the cumulative financial impact of what we want to achieve.
This methodology should be used when comparing the costs and benefits of different decisions. On its own it may not be a clear guide to making a decision. There are other points that we should consider such as employee morale, safety, legal obligations and customer satisfaction.
This methodology involves the following 6 steps:
- Brainstorm or gather data from important factors related to each of your decisions.
- Determine the costs related to each factor. Some costs, such as labor, will be exact while others will have to be estimated.
- Add the total costs for each proposed decision.
Determine the benefits for each decision. - Put the figures of the total costs and benefits in the form of a relationship where the benefits are the numerator and the costs are the denominator.
- Compare the benefits to costs ratios for the different proposed decisions. The best solution, in financial terms, is the one with the highest ratio of benefits to costs.
Example of Cost Benefit Analysis
A team of restaurant workers decided to increase sales by adding a new line of food to the menu. The new line consisted of Italian gourmet cuisine and required that an additional chef be hired. The Cost Benefit Analysis of the equipment for the first year is as follows:
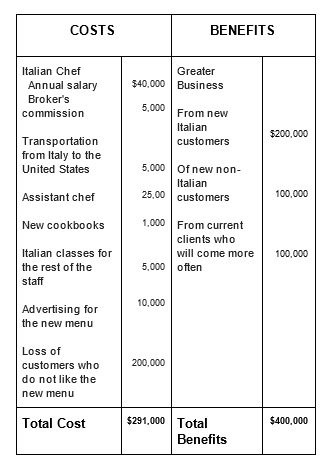
This analysis caused the team to pause to think. They were very enthusiastic about the idea of having Italian food in the restaurant and the calculations showed a substantial benefit for the first year ($109,000). However, the cost-benefit ratio was $1.37 for each dollar spent ($400,000 / $291,000). This would be a positive return, but was it worth the effort that this great change implied for the restaurant?
What would you do if you were part of the team?
Advice for construction / interpretation
Although it is desirable that the benefits be greater than the costs, there is no single answer of what is the ideal ratio of benefit to cost.
As indicated above, benefits such as employee morale, legal responsibilities and safety can be hidden benefits that are not evident in the original analysis.
Relationship with other Tools
A cost / benefit analysis is usually related to:
- Pareto graphs
- Grid of Selection
- Action Planning Matrix
- Force Field Analysis
- Checklist for data collection
Methods for the Cost / Benefit Analysis
Time – Value of Money
Different methods can be used to calculate the cost / benefit ratio. Sophisticated methods consider time – value of money as part of this analysis. Time – Value of money, also known as the discount factor, is simply a method used to convert the future value of money into present value (future dollars to present dollars). It is based on the premise that today’s dollar has more value than a dollar of future years due to the interest or profit that can be obtained. Including time – value of money can be crucial to the financial health of an organization as efforts to improve may require capital commitments for a prolonged period of time.
Common methods for the Cost / Benefit Analysis include:
- Net Present Value
- Payback Period
- Internal Rate of Return
- Breakeven Point
Below we will explain each of these using the same example of effort to improve a process to show the similarities and differences.
1. Net Present Value (NPV)
The NPV represents the Present Value (PV) of outgoing cash flows minus the amount of the initial investment (I).
Simply: NPV = PV – I
The present value of the future cash flow is calculated using the cost of capital as a discount factor. The purpose of the discount factor is to convert the Future Value of money into Present Values (future dollars to present dollars) and is expressed as 1 + the interest rate (i).
To expand our example and include the discount factor, we continue with the investment of $ 65,000 with an insured value of $ 5,000 producing annual income of $ 80,000.
Now we add the fact that the company uses an interest rate of 20% as its discount factor.
With an interest rate of 20%, the discount factor is (1 + i). The discount factor can be expressed as (1 + 0.20) or as 1.2.
Determine the NPV
Income:________________________
Insured value:___________________
Discount factor:__________________
Investment:_____________________
Formula:
PV = (Revenue + Insured Value) (Discount Factor)
NPV = PV – Investment (I)
The NPV is:_____________________
2. Payback Period
The Payback Period is the time required to recover the initial amount of a capital investment. This method calculates the amount of time it would take to achieve a positive cash flow equal to the total investment. Take into account benefits, such as the insured value. This method essentially indicates the liquidity of the effort to improve a process instead of its profitability. Like the breakeven point, the analysis of the return period does not take into account the value of money over time.
In our example, the effort to improve has an annual cost of $65,000 and is expected to generate $80,000 in revenue in the first year. Additionally, the effort to improve has an insured value of $5,000.
Determine the Payback Period
Cost:__________________________
Insured value:___________________
Total income increased and / or reduction of expenses:____________
Formula:
Payback Period = [(Cost – Insured Value) Total Increased revenue and / or cost reduction] x 12 (months)
Paybak Period is:________________
3. Internal Rate of Return (IRR)
It is the interest rate that makes the equation of the initial investment (I) with the present value (PV) of the future incoming cash flows. That is, to the Internal Rate of Return, I = PV or NPV = 0.
In our example, the company has determined that its cost of capital is 20%. Therefore, any effort to improve a project or process should exceed this difficult rate if it is to be considered.
Using our same example, we continue with an investment of $65,000 with an insured value of $5,000, producing an annual income of $80,000.
The result of the Breakeven point analysis, the return period, and the net present value calculation would indicate that this effort to improve is acceptable from the financial point of view.
When the IRR is calculated, the NPV is set to zero and resolved for an interest (i). In this case, the discount factor is (1 + i) since we do not know the true interest, we only know the desired interest.
Determine the IRR.
NPV:__________________________
Entry:__________________________
Insured value:___________________
Discount Factor:_________________
Investment:_____________________
Formula
PV = (Revenue + Insured Value) (Discount Factor)
NPV = PV – Investment (I)
To calculate the IRR, take the NPV formula to zero and solve for an interest (i).
The IRR is:_____________________
After calculating the IRR for this effort to improve a process and use 20% with the rate, will this effort to improve be accepted or rejected from a financial position? why?
4. Breakeven Point
Observing the equilibrium point to make an effort to improve is one of the simplest formulas to do the cost / benefit analysis. The breakeven point that would be taken so that the total of the increased income and / or the reduction of expenses is equal to the total cost. However, it does not take into account the value of money over time.
For example, an effort to improve has an annual cost of $65,000 and is expected to generate $80,000 in income in the first year.
Determine the breakeven point.
Cost:__________________________
Total increased income and / or cost reduction:_______________________
Formula
BP = (cost – total increased revenues and / or cost reduction) x 12 (months)
The Breakeven point is:____________