This delivery intends to explain in a very simplistic way, with elementary mathematics what confidence intervals are, where they come from and how they are related to normal curve. So, I apologize in advance with pure statistician and mathematic guys, I hope you understand I do not use too many formal terms.
Statistics we use on a routinely basis, helps us to DESCRIBE the behavior of a sample, at the same time it allows us to understand how a population may behave.
In the real world, we know it is simply not possible to get the statistical values that actually and completely describe a population; however, they allow us to DEDUCE with some degree of certainty (trust or ‘confidence’) which the ‘zone’ is where we can get the higher probability these statistics values are located.
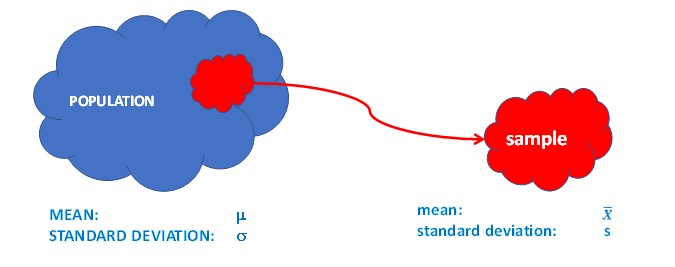
As a beginning, take a look at the following figure, trying to show the difference between population mean and standard deviation, and the same terms for a small but representative portion of data from that population (a random sample).
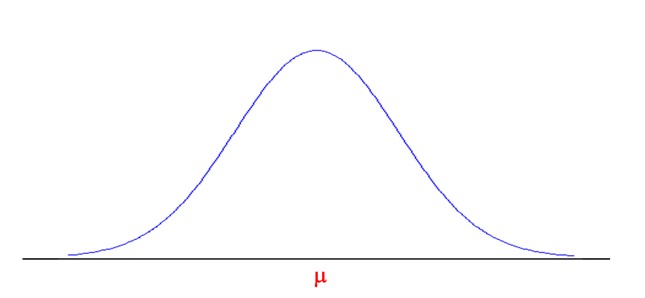
Now, let’s try to explain the concepts with normal curves. At first, suppose a population with normal distribution:
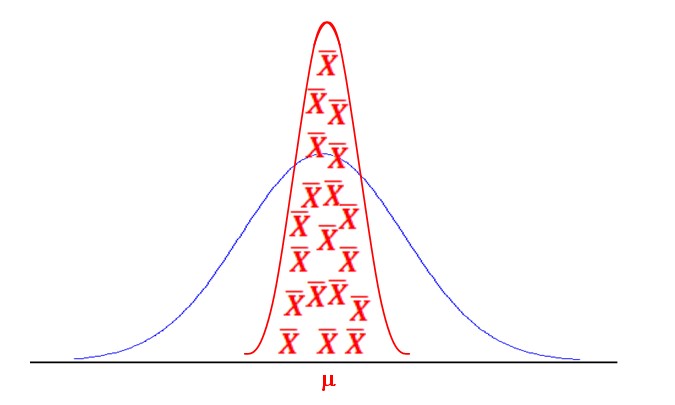
Now, randomly, take some specimens (samples) of that population:
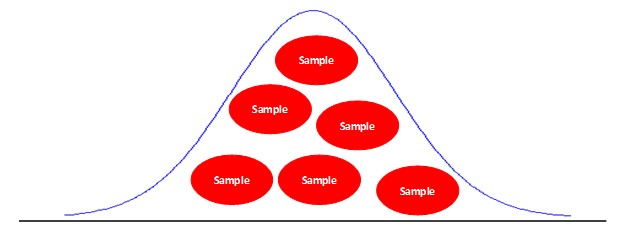
If we build a distribution of the average curve, we can get something like the following:
With those averages we can estimate:
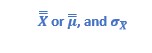
or
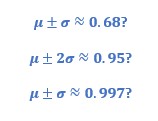
Do you remember that
If we took any mean of the samples and created an interval as follows:
There is a 95% probability that the ACTUAL average of the population (that is, if we use ALL the data to calculate the average) is in this interval.
We also can look at it with the following approach:
If the means of the samples are distributed in a normal curve, we could infer that

Then, we could say that if we build the interval:
![]()
There is a chance of 95% that if we pick any of the sample averages up, that value belongs to this interval.
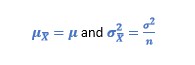
Now, let’s remind the Central Limit Theorem: given that X1, X2,…, Xn are a set of independent and identically distributed random variables from a distribution with mean μ and variance σ2≠0. Then, if n is enough large, the random variable
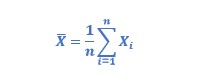
has approximately a normal distribution with
Sometimes, it is not possible to tell with enough samples to estimate σx; however, in cases in which the sample size is large enough, the standard deviation of the sample can be s, as a very good approximation, and statistically acceptable, of σ.
But, how much is a large enough sample?
Well, here is the answer: in general, can we accept that when sample size is greater than 30 items (n > 30), then sample standard deviation s, tends to the standard deviation of the population, σ.
Really? But, why?
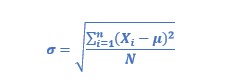
Well, the formula for the standard deviation of the population is:
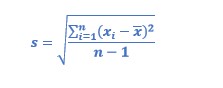
Meanwhile, the formula for the standard deviation of the sample is:
 Alright, now, which is the difference of dividing by n or (n-1)?
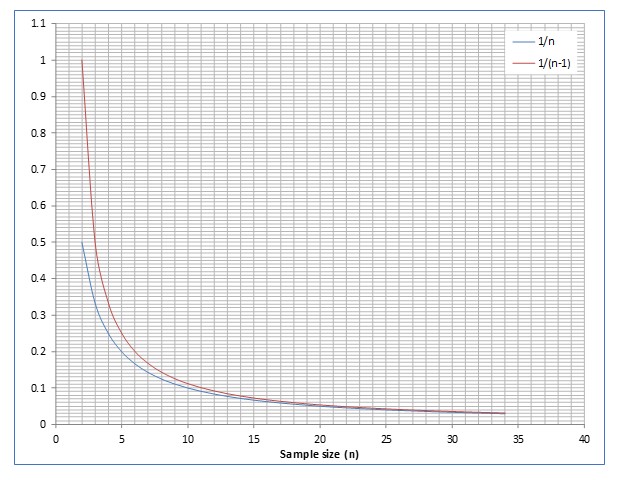
Let’s build a table with some values and then let’s build a chart, just for fun! Let’s see what we can find:
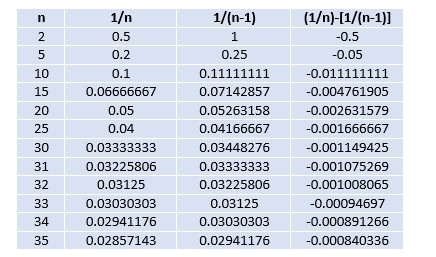
Following chart shows that, when n = 25, the two curves almost overlap
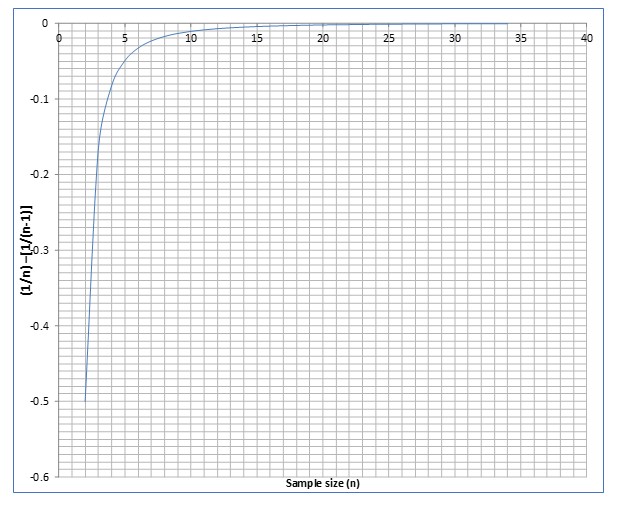
The next chart shows that when n = 25, difference between dividing by n or (n-1) is practically zero
Now let’s talk about how to calculate a confidence interval.
If you know:
σx and n;
σpop and n, or
s and n > 30
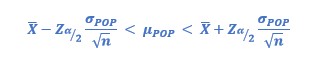
You can make the calculation by using Z (value of tables, normal distribution).
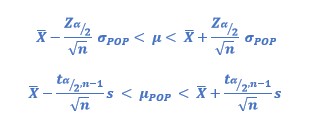
Formula is:
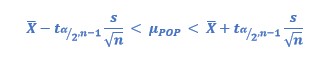
if you know s and n < 30, calculation is performed by using t (value of tables, Student’s t distribution)., and formula is:
Challenge: can you see something familiar in these two formulas?
No? OK, how about to rearrange the terms of the formulas as follows?
 Can you see anything?
No? Ok, last chance. Let’s rewrite the formulas as:
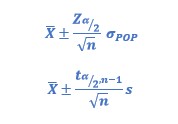 Is it familiar to you with:
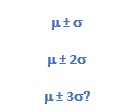
Both Zα/2 as tα/2, n-1, are the values that indicate the level of confidence that we want to have (i.e., how many ‘sigmas’ we want to calculate). These values are obtained from statistician tables.
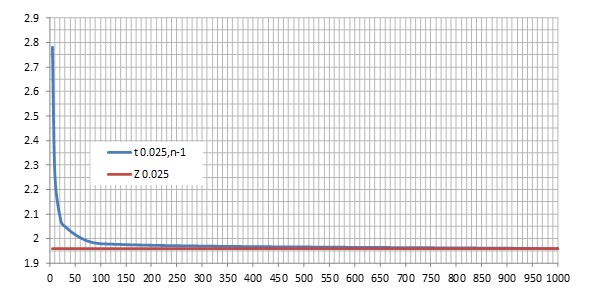
Let’s demonstrate another reason for n > 30
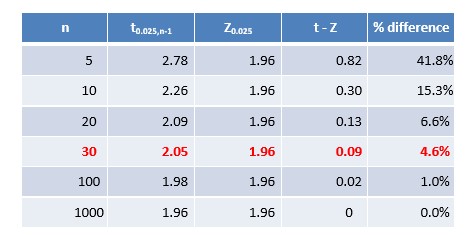
With n ≥ 30, the difference between the value of t and the value of Z is less than 5%, acceptable from a practical point of view.