
Those who have attended Six Sigma trainings or those who have studied Business Statistics as a subject in their Graduation course would know the importance of Central Limit Theorem. Central Limit Theorem forms the basis for most of the statistical calculations and analysis that we use in our day to day life.
Central Limit Theorem states that:
“Irrespective of the distribution of the underlying population, the sampling distribution of the mean tends to be Normal when the sample size of each set of samples is sufficiently large. Also the mean and variance of the sampling distribution is approximately equal to the population mean and population variance divided by number of samples”.
Let us see it one by one:
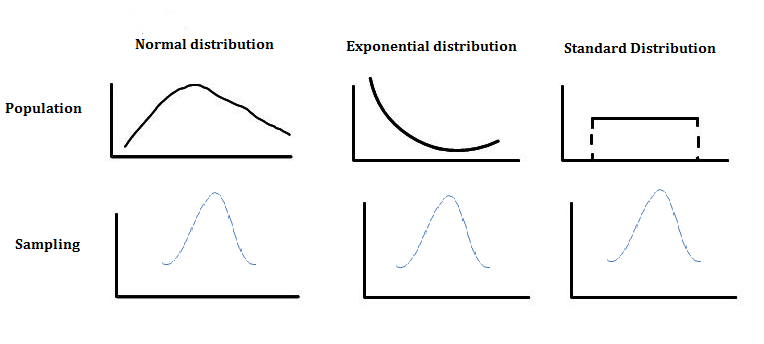
1. Irrespective of the distribution of the underlying population, the sampling distribution of the mean tends to be Normal when the sample size of each set of samples is sufficiently large.
The population that we have taken for our study can follow any distribution like Binomial distribution, Poison distribution etc. Take sufficiently large samples from the population, which are quite random. Next, calculate mean and variance the samples taken. Repeat the process for several times and plot the sampling distribution of the mean for the sampling sets drawn. Irrespective of the population’s distribution, the sampling distribution will look approximately Normal (Like a bell shaped curve).
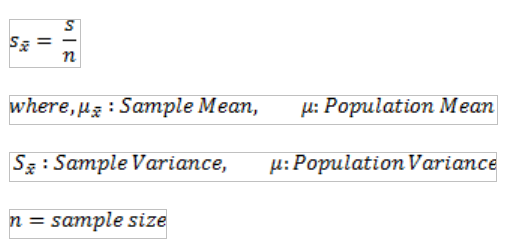
2. The mean and variance of the sampling distribution is approximately equal to the population mean and population variance divided by number of samples.
In such a scenario, the mean of the sampling distribution is approximately equal to the population mean.
The variance of the sampling distribution is the fraction of population variance by the number of samples.
This characteristic of the sampling distribution is useful in several places and applications to estimate the mean of the population, when we are not able to collect data on the whole population characteristic. This helps in calculating the estimates of mean and standard deviation by using sufficient samples and draw inferences about the population.