
Regression Analysis is a technique used to define relationship between an output variable and a set of input variables. It establishes the relationship ‘Y’ variable and ‘x’ variable mathematically, so that with known values of ‘x’, ‘y’ variable can be predicted.
There are several types of regression like Simple Linear Regression, Multiple Linear Regression, Curvilinear Regression, Logit Regression and Probit Regression etc., which caters to a variety of requirements based on the type of underlying data.
In this article, we will learn about the basic concept of Linear Regression (which is the most frequently and widely used), the terms involved in Regression and how to perform and interpret a Regression Analysis.
What does a Regression analysis do?
The entire concept of regression analysis is very simple. The foundation lies in the ‘Straight Line Equation’ that we learnt in earlier Grades of our School in mathematics.
Where:
- y: Output variable
- x: Input or Predictor Variable
- b0: Intercept or constant
- b1: Slope
- e: Error or Residual value
Like in Correlation, the ‘x’ and ‘y’ values are plotted in a Scatter plot. A line that indicates the slope of the data points is drawn.
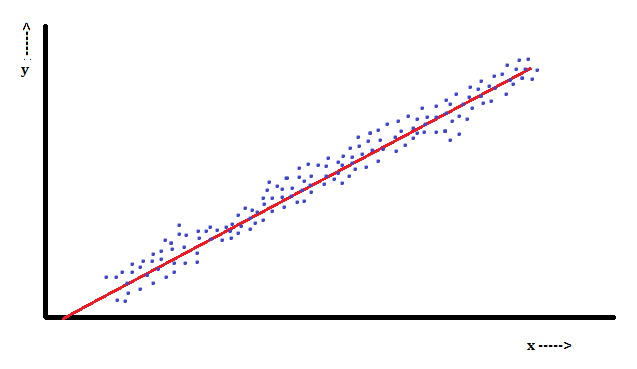
Regression Plot
The above graph demonstrates how a Regression Plot looks like. Any model will not be 100% accurate in predicting the y value. Thus there will be an error component or residual value involved in the equation. However, a good model is one that tries to minimize the error/residual values, and has a line (Regression line) that tries to be close to a maximum number of data points.
A Multiple Regression is one that has more than one input variable to predict a given y. With more than one input variable, the mathematical model looks like below:
When there are more variables, there are possibilities that there exists an interaction or correlation among the input variables. So, the model should try to identify that duplication effect, which will inflate the y value.
Terminologies in Regression Analysis
Before understanding how to perform a regression analysis, let us understand the key terminologies involved.
- Coefficients: These are the intercept (b0) and slopes (b1, b2,….,bn) of individual input variables. The values of these coefficients are extremely important in determining the Regression Equation. They are also, one of the key outputs of a Regression Analysis.
- Standard Error (SE): Most software packages provide this value SE, when performing a Regression Analysis. It denotes the standard deviation of the Residual values from the Regression line. A good model should try to reduce the Standard Error.
- Coefficient of Determination (r2): This value denotes how good and efficient the regression equation is, in predicting the y value. Typically, r2 values range from 0 to 1; 0 denoting a worst model and 1 denoting the best model. Higher is the r2 value, better is the prediction. Often, for Multiple Regression, another value known as r2adj is calculated. This value is different from r2 by eliminating the effect of multiple interrelated variables (Multicollinearity).
- Multicollinearity: It is a condition denoting the input variables being strongly correlated. In such a condition, this correlation may mask another input variable’s significance in the prediction. So, to avoid this, before proceeding to Regression, a Correlation Matrix for all the input variables is plotted and the masking effect is identified. Any one of the pair of variables with strong correlation is removed based on the business knowledge of the problem.
How to Perform a Regression Analysis?
- Identify the relevant input variables and collect data on all the input variables and output variable.
- Select the suitable regression model (Simple Regression, Multiple Regression etc)
- Calculate r2 value. Now a days a lot of software packages, add-ins are available to perform the entire calculation and analysis.
- Assess the p value for each of the input variables (p-value less than the confidence level considered indicates that the variable is a useful predictor). Remove any variables with p-value > confidence level.
- Test the variables for Multicollinearity and remove duplicate variables.
- Develop the predictor equation with significant and shortlisted variables only.
Thus the new equation will be a good predictor for a given problem, provided a correct model, accurate data and a good calculation methodology is used.