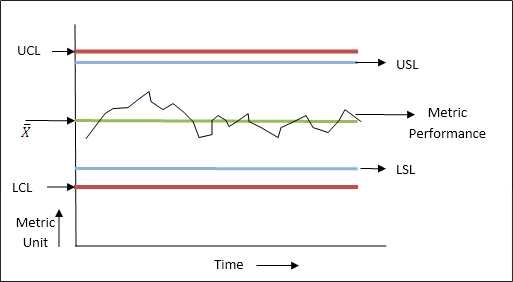
Statistical Process Control or SPC was first coined and introduced by Walter A. Shewhart in the early 1920s and over a period of time, further developed into a strong conceptually proven process. The term Statistical Process Control has a simple meaning – a Process controlled using statistical tools. In SPC we use mostly the two statistical tools – Control Charts and Design of Experiments (DoE).
Statistical Process Control is very popular in Manufacturing Industry as it helps in the process of detecting problems at an early stage and thereby preventing them from occurring which is an ideal situation expected by any organization.
Control Charts
What is a Control Chart? How does it help in keeping a process under control?
The Control Chart is a statistical tool that captures the defects (performance metrics in service industries) occurring against the timeline in real time scenario. The Control Limits bring in the Controls in the Process (in absence of Control Limits it will be a simple run chart) and is defined by a simple equation.
Where,
These Control Limits are also called as Natural Process Limits – Upper Natural Process Limits (UNPL) or Upper Control Limits (UCL) and Lower Natural Process Limits (LNPL) or Lower Control Limits (LCL). These Control Limits are naturally defined by the Process and is completely different from Specification Limits which also is a part of Control Chart.
Whereas the Control Limits are automatically defined based on the average performance of the Process, Specification Limits are pre-defined and/or specified by clients or is a process requirement and any non-conformity may lead to re-work or discarding of the product.
As mentioned earlier that Control Charts help us in controlling the defects and prevents it from non-conforming, let’s understand it in a bit more detail. We know very well that no two products are identical even if they are produced with the same machine under same environmental conditions. Thus, in a production set-up we can expect all the products to be distinct from each other even if they are lying well within the Control and Specification Limits. So, in a Production Set-up we can observe 2 types of data variation, one occurring due to the Common Causes or Non-Assignable Causes and Special Causes or Assignable Causes.
Common Cause Variation: The variations in a product that are caused due to many common natural factors that does impact the stability of the Process performance and is repeated over a period of time without any specific reasons attached to it are known as Common Cause Variations.
Special Cause Variation: These are variations that occur suddenly, unpredictable and impact a part of the Process Output thereby violating the rules defined in Control Chart. The reasons for the variations are easily visible and necessary actions will enable the Process to revert back into a controlled state.
A Process by and large does not follow a Bell Curve or Normal Distribution as often discussed in theory, basically due to the above discussed process variations. Now, when we discuss about variation, if all the data points of the Product lies within the Control Limits, the Process is stable and does not require any intervention. This kind of Controls during the Production State ensures that conformance is achieved and thereby eliminating the need to inspect each/sample of products post production.
We have seen how Control Charts helps in controlling a Process in real-time. So now we can discuss a bit about how Design of Experiments helps us in controlling a Process performance. Design of Experiments as we know is a series of experiments carried out before a product or a new feature in a product is introduced.
So the question now is how are Control Charts and DoE linked in controlling a Process?
The answer is simple – DoE defines the design aspects of a finalized product and will give complete information on how the product would behave in different conditions. With this information in hand its easier for the Production Team to predict and infer the change in behavior occurring during production.
Triggers can be set to ensure the changes or improvement to be carried out in the Production set-up to seamlessly keep producing the product without any defect. For e.g., the thickness of car window panes should conform to the pre-defined requirements in such a way that it fits properly on the car door. During the course of time, because of wear and tear, the thickness may increase which will result in higher material utilization and also discarding of the units.
With Control Charts we can view the deviation trend in a real time and referring to the DoE data we can predict after how many unit productions it will start producing non-conforming units. Hence, it will help in taking appropriate actions before any damage can happen.
That is why Statistical Process Control is religiously followed in all manufacturing industries and being slowly adopted in service industry as well. To conclude, SPC not only keeps the process under control but also helps the organization in controlling the revenue leakage (due to re-work or product rejections) and improve customer satisfaction.

