FMEA or Failure Mode and Effects Analysis is the systematic procedure or tool in determining possible failure modes of any given process, product or design. It is a step by step course of action that analyzes each phase or progression of the study. FMEA will also take into consideration the potential effects of the failures to the overall process goal, help planners and managers identify and prioritize failure modes and review on the results of action plans implemented.
This is an effective quality management tool that is used to design a process, review and improve the process and is also an efficient process control.
FMEA originally started as a management procedure by the US military in the 1940s. By the 1960s, NASA’s quality management incorporated the use of FMEA in all their projects. Nowadays, FMEA is widely used in manufacturing, banking, service centers and almost all business industries.
The FMEA procedure is effective when analyzing an existing process, service or a product with the purpose of improving it. This will help managers and analysts identify the pain points to improve or change. You can also use FMEA when developing a new process or a process in producing a product or service. Through FMEA potential failures are being identified thus courses of actions to counter the failures can be employed or processes could be revised and improved, effectively avoiding the failures and saving the company’s resources.
FMEA is also a good tool to use when planning to apply a certain process, usually a successful one, of one product or service to another. This is also a good way to improve lagging process performance like low sales, low customer satisfaction ratings or high expense to income ratio.
The FMEA Procedure
To be effective, FMEA should be a team endeavor with members who are experts of every aspect affecting the process. The team should be able to establish the scope, boundaries and goal of the study. With that in mind, they need to fill-in the FMEA table:

A Basic FMEA Table Template
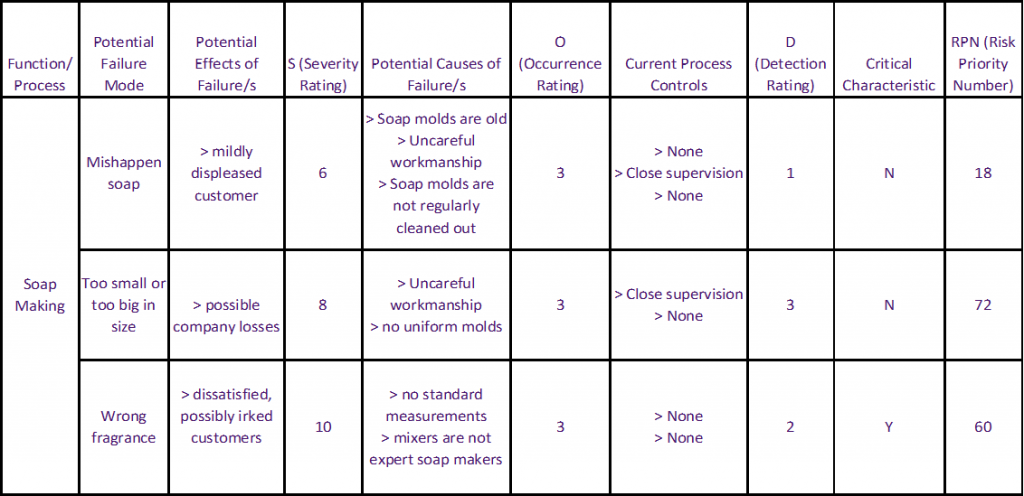
For our discussion, let us use “Soap Making” as an example. Your FMEA team could include the Quality Control Manager, the Factory Supervisor, the Product Manager, the Marketing Director, the Cost Accountant and the General Manager. Take note that they have diverse expertise yet everyone’s opinion is valuable in the decision making process. After an imaginary brainstorming, they came up with the following entries to the FMEA table:

An Example Filled FMEA Table - Step 1 - Problems And Failures
Under the potential failure modes, the team listed three possible failures in soap making and its respective effects and potential causes. For severity, analysts can assign severity for the respective failure mode from a low severity of 1 to a high 10. Occurrence is scored in the same manner while detection is scored in reverse. If a failure is highly detectable, the score is low. Hard to detect failures should be scored high in detection.
RPN is the product of severity, occurrence and detection. (RPN=S*O*D) Critical characteristic is mostly optional in many companies because of its subjectivity. It is the measure of the overall impact of the failure to the company. It is usually scored “Y” or “Yes” if either severity or occurrence is at 9 or 10 and if detection is higher than 3.
Based on the accomplished table, priority should be on the uniformity of size because it has the highest RPN and wrong fragrance because of its critical characteristic. The company’s scarce resources will then be channeled to these two failures.
When deciding on the courses of action, a good basis will be the current process control panel. This will give us an idea on what to improve on. For the second failure, the company rely the uniformity of soap sizes on the supervisors to put in force diligence on the part of the workers, while there are no controls in place for the mixers, most particularly in the appropriation of fragrance.
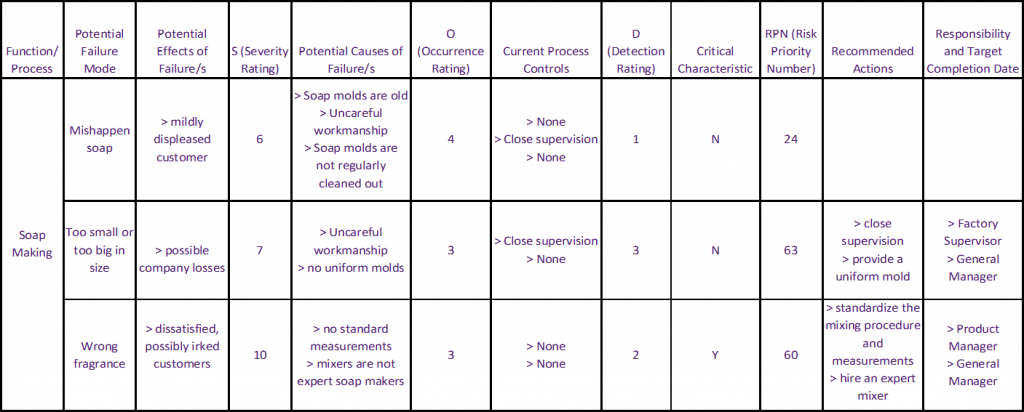
The next step for the FMEA team would be to come up with action plans to counter the failures:

An Example Filled FMEA Table - Step 2 Actions And Solutions
It is also important to assign ownership or responsibility of the course of action and define the length of time for the cycle or the period for which the action plan is to be implemented before another FMEA analysis. One cycle could vary from several weeks to a year. Most companies set the FMEA cycle to a month or a quarter (three months).
Second Cycle FMEA
After one cycle of implementation of the action plans, the team will again assess the process and its failure modes.

An Example Filled Second Cycle FMEA Table
Due to the implementation of the courses of action or process control improvements, the re-assessed occurrence ratings will change. The severity scoring always stays the same all throughout the cycles unless the company changes its goals or customer profiling. Detection will also change based on the process controls implemented but for our example detection remained constant because the action plans were focused on the occurrence of the problem.
Note that the ratings for the misshapen soaps failure remained the same. This is because no action plan was implemented to resolve the problem. The problem on size uniformity has been addressed significantly as it has the biggest drop on RPN due to the drop on its occurrence. The problem was addressed by simply hiring an expert and standardizing the mixing procedure and measurements.
Given the results of the Second Cycle FMEA, the failure on misshapen soap already ranks as the top failure in the soap making process. It is therefore the priority failure mode and the company’s scarce resource will then be channeled to resolve the problem. You can conduct FMEA analysis periodically to check on the performance of the process.
Limitations of FMEA
The FMEA analysis is solely dependent on the opinions of the team. Any problem beyond their knowledge will stay undetected and unresolved. The tool also relies a lot on objectivity and effectively eliminates the qualifying characteristics of the variables. Since scoring are only based on educated projections and arriving at the RPN is by multiplying the scores, slight variation, like scoring detection 2 instead of 1 will effectively double the RPN score, though in reality analysts just scored it a 2 to put it ahead of another failure they scored as 1.
