
A3 Report
One might wonder what A3 report is all about. A3 is an abbreviation of a difficult technical term? , Or another statistical method and reporting? , Or yet another tedious graphical tool or software?
It would be surprising to now that A3 report is not any of the above, but a very simple Problem Solving Activity in the form of an A3 sized sheet. Yes, it is named because, we use an A3 size report for this problem solving exercise and reporting.
Yes, but why A3? The idea is to simplify the problem solving exercise and reporting and make the report an easy and concise one for the readers, by presenting only the correct and required information rather than taking them through pages of report, slides of presentation. It is about saving time and presenting only the critical items and make them understand it easily and correctly.
What does an A3 Report have? There is no Standard content of template for an A3 report. Since A3 report is mainly used for Problem solving, it contains all topics/items necessary for a Problem Solving process. It follows a typical PDCA (Plan-Do-Check-Act) approach. Therefore, some of the items that are usually present in an A3 Report are:
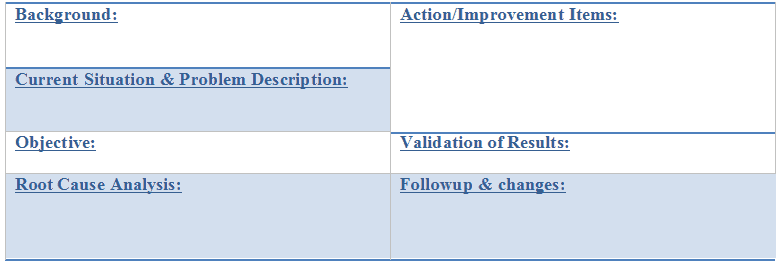
- Background
- Current Situation and Problem
- Objective
- Root Cause Analysis
- Action/Improvement Item
- Validation of Improvement
- Follow-up and Changes
A simple example of how an A3 report will look is given below.
A3 Report has found its use in various places, including the famous Toyota Production System. For simple and small scale problems where tools like Six Sigma, Value Stream Mapping are too technical to use, the PDCA approach with A3 reporting is used. This creates a concise and precise thinking approach in the mind of employees. Because it looks simple, logical and easy, a wide range of workforce can use it with minimal resource requirement (An A3 size paper and a fair amount of time of stakeholders).