
STATISTICAL PROCESS CONTROL: WESTERN ELECTRIC RULES
The DMAIC Methodology in Quality Management, consists of five main steps that organizations utilize in order to satisfy customer requirements. In sequential order, these steps are:
Define
Measure
Analyze
Improve
Control
The control phase of the process, is the final sustaining phase of this continuous improvement cycle. Every time a process change is made, it is in the best interest of the organization to implement a visual control system or background built-in engineering controls, that will ensure that a change is made. Statistical Process Control facilitates process analysis, and via simple rules, an analyst can determine if their process of focus is operating within appropriate process limits.
When customers make requests of an organization, a company must prove that they are in control and capable. The Western Electric Rules, are quality tools that are utilized to facilitate and validate this demand. When control charts are analyzed, using these rules will ensure that out of control conditions are easily identified, so that corrective action can be taken.
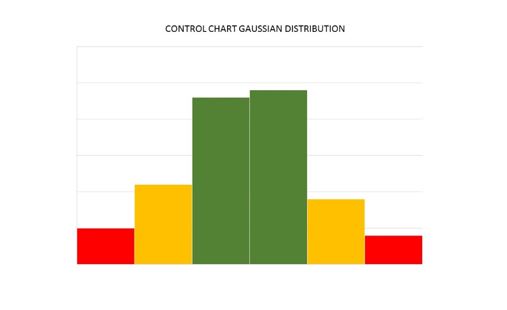
Image 1: Control Chart Data Distribution
Western Electric Rules classifies data points into three distribution zones:
Zone A: Using the centerline as the baseline, between the 2σ and 3σ points. This phase is demarked by the red indication in Image 1 above.
Zone B: Using the centerline as the baseline, between the 1σ and 2σ points. This phase is demarked by the amber indication in Image 1 above.
Zone C: Using the centerline as the baseline, between the 1σ points and the centerline. This phase is demarked by the green indication in Image 1 above.
Typical data distribution points in a process, follow a Gaussian or Normal Distribution curve indicating a fluctuation of the data points around a center line, or target. An in control process has its data points naturally varying about its target within ±3 standard deviations. If there is any noticeable trend in the data points eg. upward trend or downward trend, a disturbing process change has occurred, and investigations are to be carried out to identify the root cause of the issue, and mitigate against further propagation in the downstream process.
The team at the Western Electric Company, was first to pioneer such a methodology in 1956 and the industry has adopted this best practice. Standardized control chart analysis is the final outcome. As with every quality related activity, it is important to ensure that all persons view the process in much the same way, so that they can react to deviations in the same manner once they arise.
Western Electric Rule Focus points:
Natural variation is expected in process operations. Process analysts should be concerned when data points shift from the expected centerline. In statistical terms this occurs when un-natural patterns are observed in data analysis. There are four main types of unnatural patterns. These are mixture, stratification, instability or repetition. All cause shifts in the data distribution, and they do so in a manner that either shifts the center line data point accumulation, moves the data towards extreme control limits, or outside of the upper or lower control bands.
From the previously identified zones, statistical zone rules are applied in the interpretation of the data. These rules are as follows:
Rule 1: If a single data point is outside of zone A, this rule is utilized.
Rule 2: On the same side of the centerline, in a sequence of points, if two out of three sequential values fall into zone A or exceed the control limits, rule two is utilized.
Rule 3: On the same side of the centerline, in a sequence of five points, if four are in zone B, or A, rule 3 applies.
Rule 4: On the same side of the centerline, in a sequence of eight points, if all fall into zone C or beyond, apply rule 4.
Analysis of control charts will allow an analyst to decipher, which control zone, and control rule to apply to their scenario. Once the relevant criteria is identified, then the relevant action can be taken.
Statistical process control is applicable to a multitude of fields including the chemical industry, the semi-conductor industry, and the medical industry. Many critical variables are monitored in each respective industry, and controlled using this quality management tool. As a visual control tool, Western Electric Rules are second to none, so try to ensure that they are thoroughly implemented and utilized, to facilitate an in control and capable system.